

Is your company in multiple markets? Do you want it to be? Many direct selling companies do business in multiple countries. On average, the top 50 US-based direct sales companies operate in 33 countries (ranging from 1 to 165 countries). If you run an MLM, chances are you’re operating—or want to operate—in more than one country.
When you’re looking to expand internationally, you need to do your homework. Before you move into any country, you need to study that country—study their culture, their sales numbers, their economic realities, and their regulations.
Today, let’s take a close look at the latest worldwide network marketing facts and statistics.
We first ran this analysis back in 2018 using 2017 data. Today we’re taking a look at the 2021 data from the World Federation of Direct Selling Associations (WFDSA). The WFDSA represents 63 national direct selling associations and provides a wealth of information about direct selling and multilevel marketing around the world.
Note: All monetary data included throughout this article are adjusted to 2021 USD.
The single largest product category is Wellness at 35% which is down from 2020’s 36.2% of the global market. Cosmetics and personal care products come in second atb25% which is down from 2020’s 26.2%. And the third most popular product type is household durables at16% which is up from 2020’s 14.4%—think Tupperware and Pampered Chef. 2020 had an upward trend for wellness.
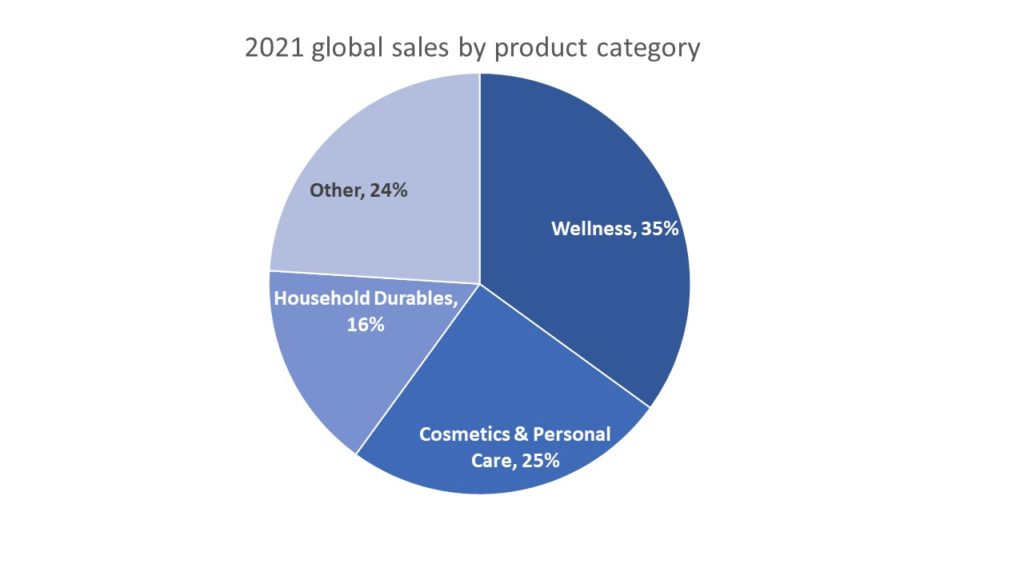
No big surprises here. These are the big three categories that come to mind when one thinks of direct sales.
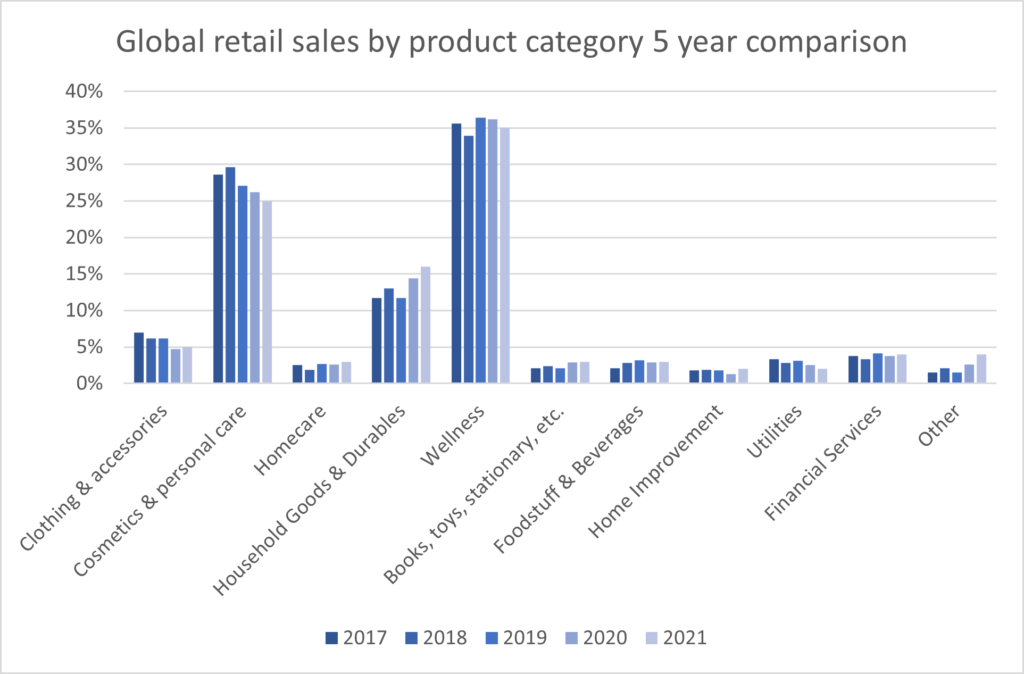
We can also look at a five-year comparison of this breakdown to see what trends are ongoing in product types. Clothing & accessories, cosmetic & personal care, and utilities appear to be declining. Household durables, books/toys/stationary/etc., and other are all rising in popularity. Home care, wellness, foodstuff & beverage, and financial services seem to be staying at around the same place.
| 2017 | 2018 | 2019 | 2020 | 2021 | |
| Clothing & accessories | 7% | 6% | 6% | 5% | 5% |
| Cosmetic & personal care | 29% | 30% | 27% | 26% | 25% |
| Home care | 3% | 2% | 3% | 3% | 3% |
| Household durables | 12% | 13% | 12% | 14% | 16% |
| Wellness | 36% | 34% | 36% | 36% | 35% |
| Books, toys, stationary, etc. | 2% | 2% | 2% | 3% | 3% |
| Foodstuff & beverage | 2% | 3% | 3% | 3% | 3% |
| Home improvement | 2% | 2% | 2% | 1% | 2% |
| Utilities | 3% | 3% | 3% | 3% | 2% |
| Financial services | 4% | 3% | 4% | 4% | 4% |
| Other | 2% | 2% | 2% | 3% | 4% |
Note that the ‘other’ category is growing. What this tells us is that the lineup of products sold in the industry is increasing in diversity over time.
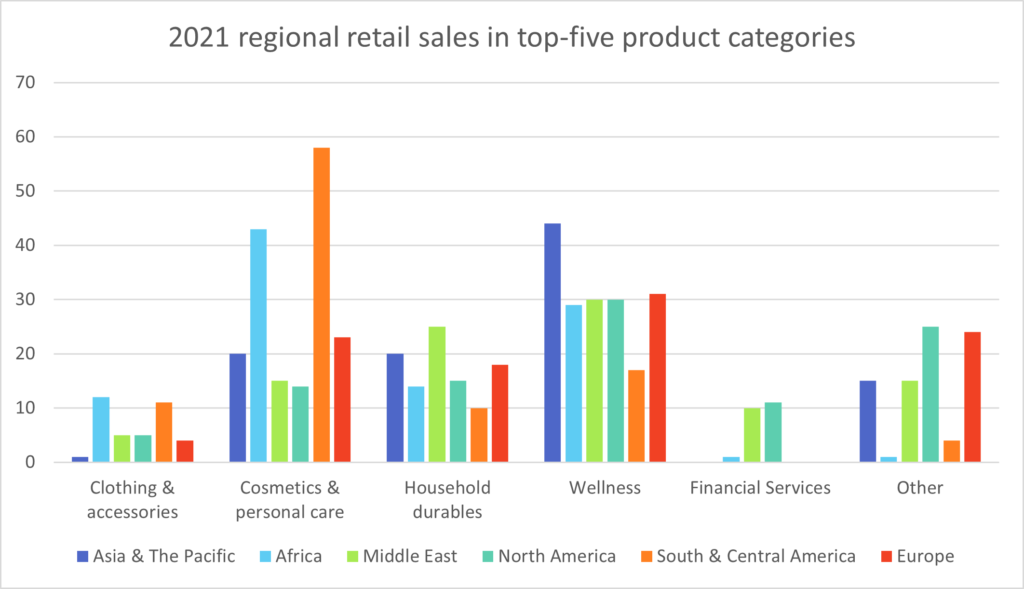
The breakdown of product type popularity varies from region to region. Wellness is the top category in Asia and the Pacific (44%) as well as North America (30%), the Middle East (30%), and Europe (31%). However, cosmetics and personal care items win in Africa (43%) and South & Central America (58%).
| Clothing & accessories | Cosmetics & personal care | Household durables | Wellness | Financial services | Other | |
| Asia & the Pacific | 1% | 20% | 20% | 44% | 0% | 15% |
| Africa | 12% | 43% | 14% | 29% | 1% | 1% |
| Middle East | 5% | 15% | 25% | 30% | 10% | 15% |
| North America | 5% | 14% | 15% | 30% | 11% | 25% |
| South & Central America | 11% | 58% | 10% | 17% | 0% | 4% |
| Europe | 4% | 23% | 18% | 31% | 0% | 24% |
Another interesting takeaway from the regional breakdowns is the size of the “other” category. A large “other” category like that seen in North America (25%) and Europe (24%), indicates a wide diversity of products. On the other hand, a small “other” category in Africa (1%) and South & Central America (4%) indicates a relatively homogeneous lineup of popular products.
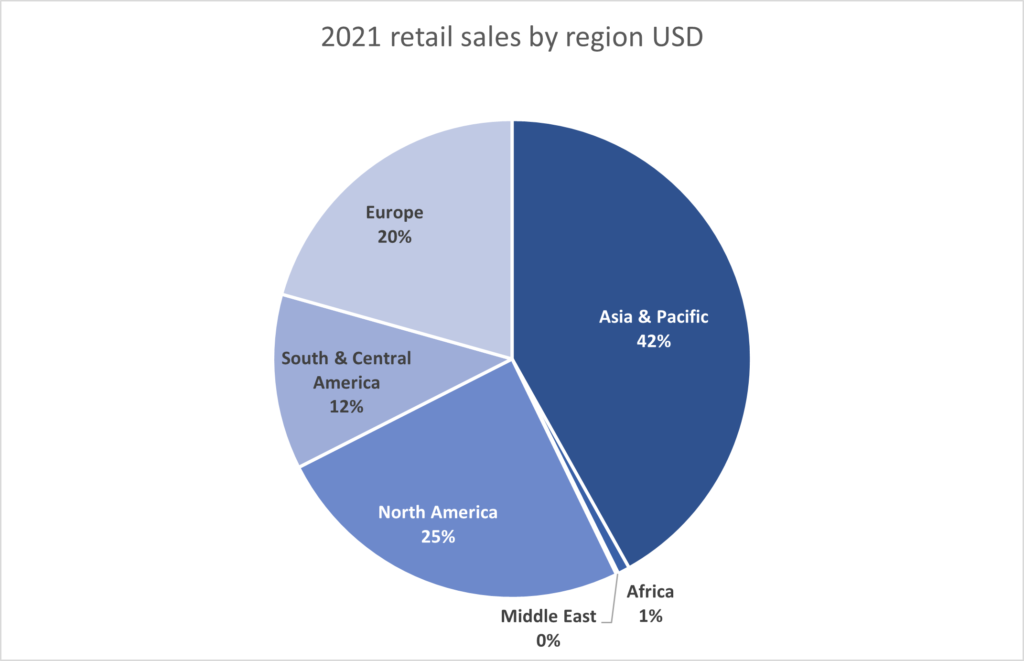
2021 worldwide industry sales were $186 billion (adjusted to 2021 USD)—up 1.5%. That sales data breaks down into four regions. Asia and the Pacific generate the most direct sales worldwide, followed by the Americas.
| Total retail sales | % of global sales | Year over year % change | |
| Asia & the Pacific | $78B | 42% | down 2.2% |
| Africa | $1.5B | 0.8% | down 11.3% |
| North America | $45B | 24.7% | up 5.8% |
| South & Central America | $22B | 11.8% | up 5.6% |
| Europe | $38B | 21% | up 2.8% |
| Middle East | $267M | 0.14% | down 1.8% |
The Americas and Europe saw the greatest growth in 2021 with America showing 5.8% increase and Europe showing 2.8% growth.
Asia and the Pacific saw a decrease in direct sales (-2.2%).
Let’s look at a five-year comparison of retail sales.
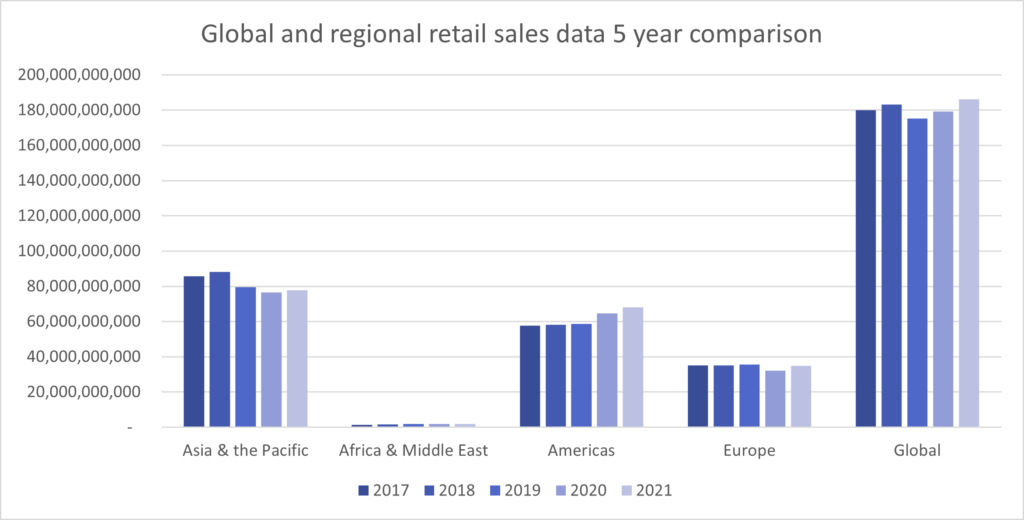
| 2017 | 2018 | 2019 | 2020 | 2021 | |
| Asia & Pacific | $85.7B | $88.1B | $79.4B | $76.5B | $77.9B |
| Africa & Middle East | $1.5B | $1.6B | $1.8B | $1.9B | $1.9B |
| Americas | $57.6B | $58.3B | $58.6 | $64.7 | $68.0B |
| Europe | $35.0B | $35.1B | $35.6B | $36.2B | $34.8B |
| Global | $180.0B | $183.1B | $175.3B | $179.3B | $186.1B |
In this comparison, we can see that the global market was up in 2018 ($183.1B), down in 2019 ($175.3B), and back up in 2021 ($186.1B).
The cause for the downturn came out of Asia. Asia too was up in 2018 ($88.1B) but has been down in 2019 ($79.4B), 2020 ($76.5B) and 2021 ($77.9B). It’s disappointing to see this downward trend.
In the earlier version of this article (based on data from 2017), we discussed a downward trend we were seeing in North American sales. It’s exciting to see a reversal of this trend. The increase is widely attributed to the COVID-19 pandemic.
It is unclear why 2021 is down for some companies. Herbalife reported that distributors that signed up during the pandemic underperformed. This is an interesting finding. Many turned to gig work to supplement or replace income lost during the pandemic. It may be that not all of those people were cut out for sales or did not recieve the right training and support. As you will remember, training went online as people were confined to their homes. It may be that the method of training had some impact. LegalShield is one company that found that Zoom trainings worked well for distributors. Other companies may have had difficulty pivoting to online meetings.
Let’s take a minute to talk about distributors.
The total number of distributors worldwide increased from 125.4 million to 128.2 million. Let’s look at a comparison of the distributors and total retail sales per region.
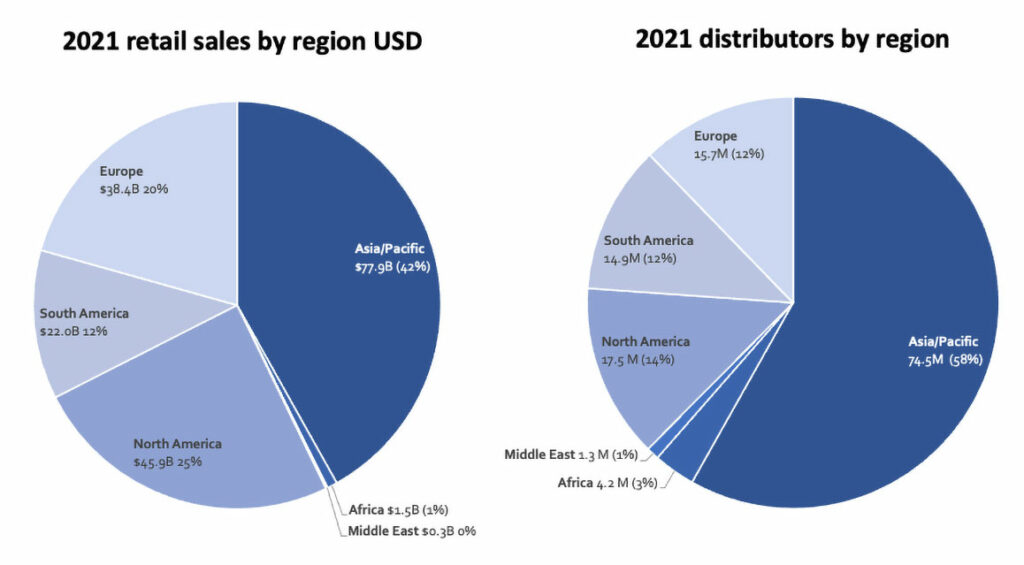
In one region, the total sales might be greater and the sales effort each distributor needs to do might also be greater.
Africa and the Middle East, the two smallest regions, offer a standout example of the disparity between sales and distributors. Together these regions produce 1% of worldwide sales, but they are home to 6.4% of worldwide distributors. If the product is for poor consumers, the price point is going to be very low. If the average price point is lower than in other regions, it will take a larger number of distributors to make the same dollar value of sales.
On the other end of the spectrum, the highest sales region, Asia and the Pacific produce 42.7% of all sales, but 59.2% of all distributors live there. Again, more distributors producing lower dollar amounts.
In both examples, individual distributors contribute less sales on average than their American and European counterparts.
Let’s look at a visual representation of the sales per distributor for each region:
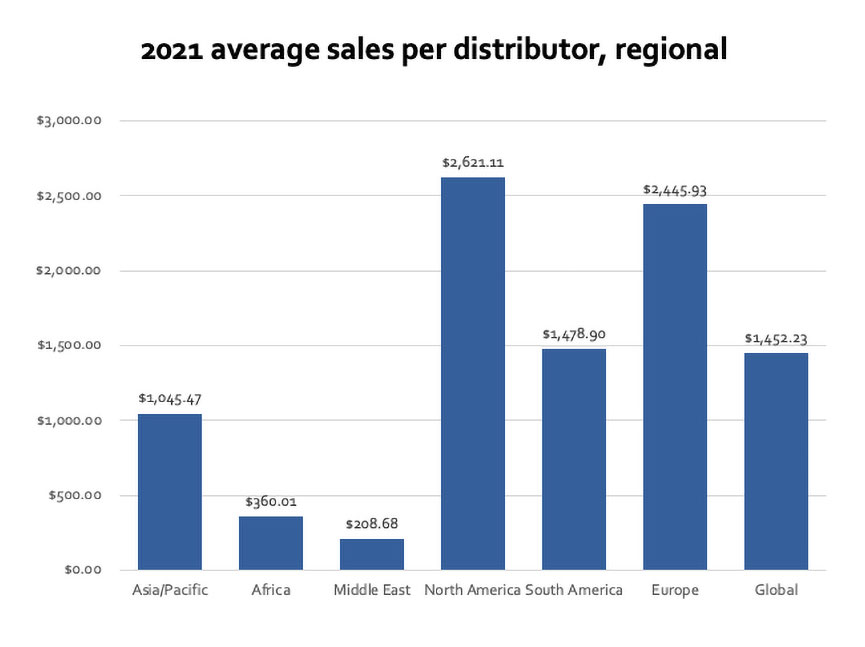
| Total retail sales | Total distributors | Average sales per distributor | |
| Asia/Pacific | $77.9B | 74.5M | $1,045.47 |
| Africa | $1.5B | 4.2M | $360.01 |
| Middle East | $0.3B | 1.3M | $208.68 |
| North America | $45.9B | 17.5M | $2,621.11 |
| South America | $22.0B | 14.9M | $1,478.90 |
| Europe | $38.4B | 15.7M | $2,445.93 |
| Global | $186.1B | 128.2M | $1,452.23 |
It’s important to consider two caveats while looking at these numbers. First, the way that any given region (or company for that matter) defines a ‘distributor’ varies. For example, in their statistical reports, the US-based DSA lists some ‘distributors’ as ‘discount buyers.’ It is unclear in the WFDSA data if discount buyers are reported as part of the distributor count.
The US used to report discount buyers as distributors. In a move to try to have more customers in the US, many companies started to reclassify anyone that does not have a downline as a customer. The model in the US used to be that you should sign everyone up to be a distributor because you never know who will take off and be a salesperson or sales leader for you. Since Vemma and Herbalife cases, companies have moved to classifying customers more often. For example, Melalueca you are automatically a customer until you have recruited someone to buy product. You can then move on to being a distributor.
The second caveat that you need to consider in these averages is the fact that these numbers are means, not medians. In other words, it’s very likely that high-end distributors are skewing the numbers. Mean isn’t the most accurate measurement of what the “typical” distributor sells. But it’s a much easier number to come by, and it’s still an interesting number to look at for comparison.
While Asia and the Pacific are racing ahead in total sales numbers, their sales per distributor are lagging behind North America. North America, in turn, falls behind Europe. In other words, Asia’s collective buying power is greater, but on an individual level they have less buying power.
The takeaway: If you take your products from Europe to Asia, you might need to rethink pricing, packaging, or even the product itself to maximize your potential in those markets. In one region, the total sales might be greater and the sales effort each distributor needs to do might also be greater.
And it might go without saying, but if you want to sell in the Middle East and Africa, the most competitive product might be completely different.
By the way, that’s not a caution against entering those markets. You must tailor your strategy, but if it makes sense for you to do that, do it! Individuals in Africa and the Middle East might have the least buying power, but the non-monetary benefit of operating there can be substantial.
Let’s look at how direct sales data breaks down by country. 78% of all direct sales take place in the top 10 countries:
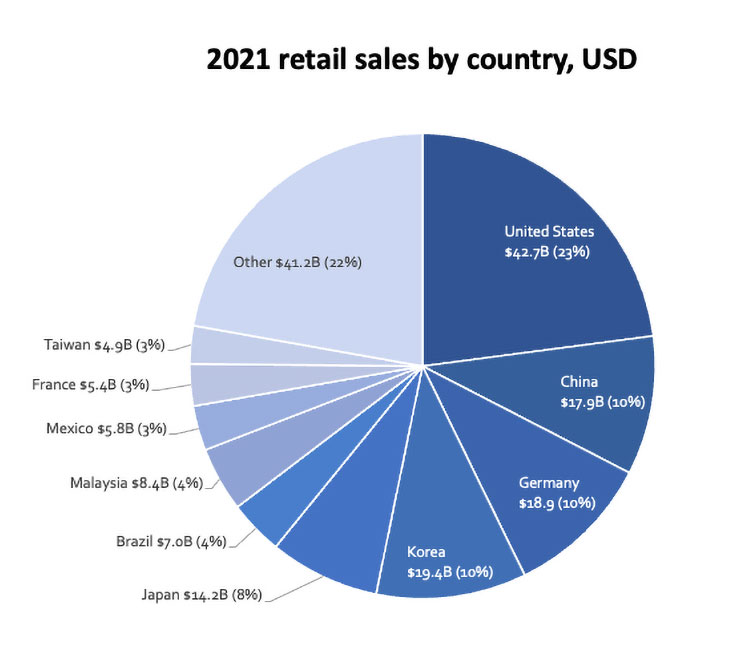
| Total retail sales | Percentage of global sales | |
| United States | $42.7B | 23% |
| China | $17.9B | 10% |
| Germany | $18.9B | 10% |
| Korea | $19.4B | 10% |
| Japan | $14.2B | 8% |
| Brazil | $7.0B | 4% |
| Malaysia | $8.4B | 4% |
| Mexico | $5.8B | 3% |
| France | $5.4B | 3% |
| Taiwan | $4.9B | 3% |
If you’re prioritizing which countries you want to open, it’s a good idea to take this list into consideration.
When we created this report back in 2017, the United States and China were neck and neck—both generating 18% of worldwide sales. Today, the United States is far ahead at $40.1B retail sales, more than twice as much as China’s $19.2B. It may be that China has fallen in sales, or it is possible this shift was caused by a reporting error in the 2017 numbers. According to DSN, “the closed nature of China’s market resulted in the use of data estimates from the most reliable sources available”. The decrease in 2019 is believed to be a consequence of increased regulatory oversight on direct sellers.
Here’s the growth history of the top ten nations.
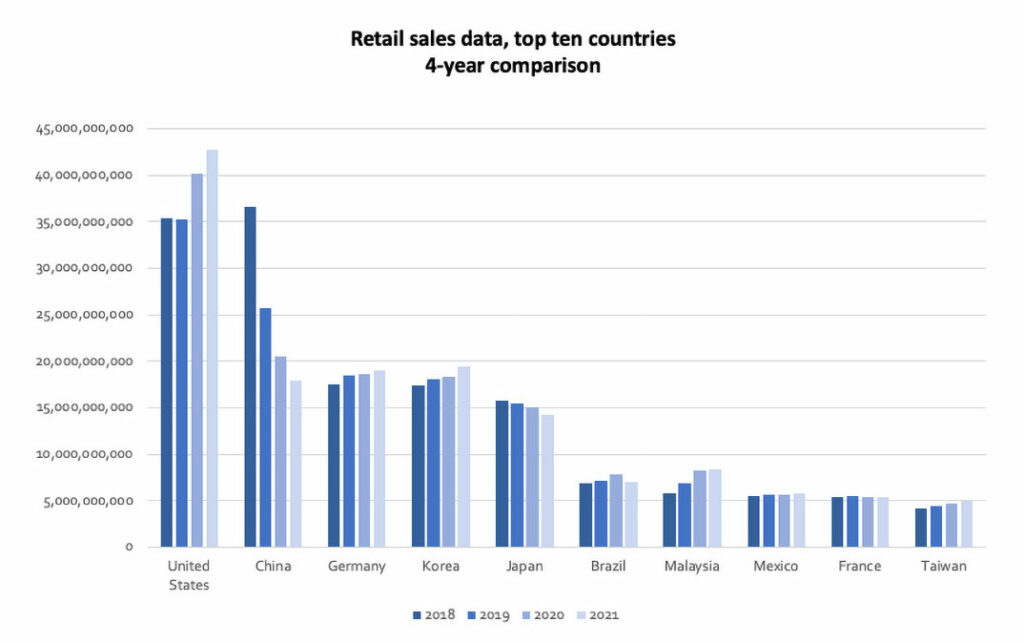
| 2018 | 2019 | 2020 | 2021 | |
| United States | $35.4B | $35.2B | $40.1B | $42.7B |
| China | $34.3B | $24.0B | $19.2B | $17.9B |
| Germany | $17.0B | $17.8B | $18.0B | $18.9B |
| Korea | $16.8B | $17.5B | $17.7B | $19.4B |
| Japan | $16.1B | $16.0B | $15.4B | $14.2B |
| Brazil | $7.2B | $7.5B | $8.3B | $7.0B |
| Malaysia | $5.7B | $6.0B | $7.0B | $8.4B |
| Mexico | $5.3B | $5.4B | $5.3B | $5.8B |
| France | $5.2B | $5.3B | $5.1B | $5.4B |
| Taiwan | $4.0B | $4.2B | $4.5B | $4.9B |
Here again we can see the progression of the divide between the United States and China. The US had an increase year in 2021 while China continued its downward trend.
The WFDSA also shows us the number of distributors in each country.
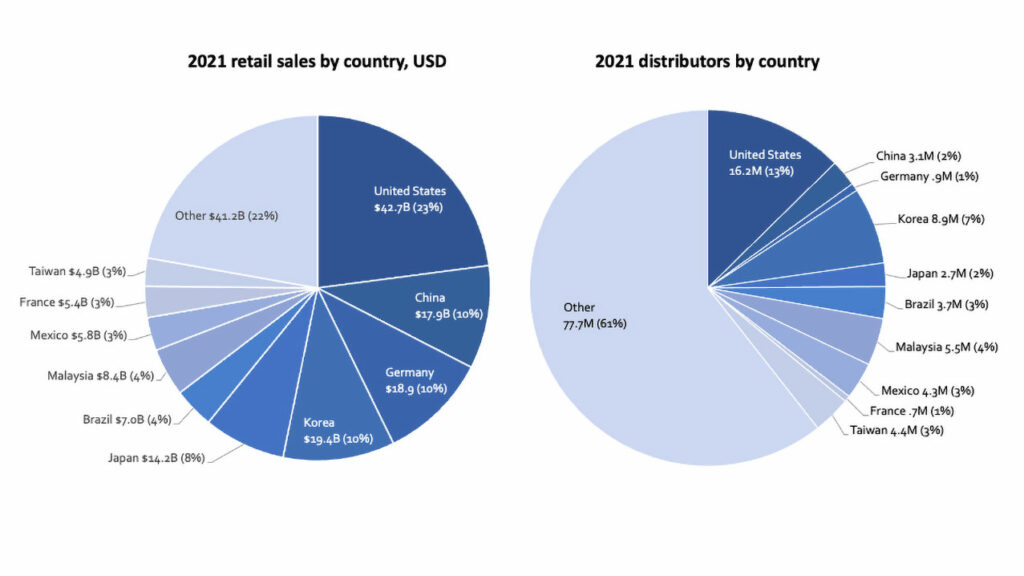
While these ten countries produce nearly 78% of the sales, they comprise less than half of all worldwide distributors. This is a powerful visual representation driving home the lesson we teased out a moment ago:
Not all distributors will be able to generate the same sales numbers. And some of that disparity has to do with the practical circumstances surrounding distributor lives.
Again, let’s look at total sales per distributor for each top ten country. (You can of course go through the full data on the WFDSA report to do the same analysis of any country we didn’t look at here.)
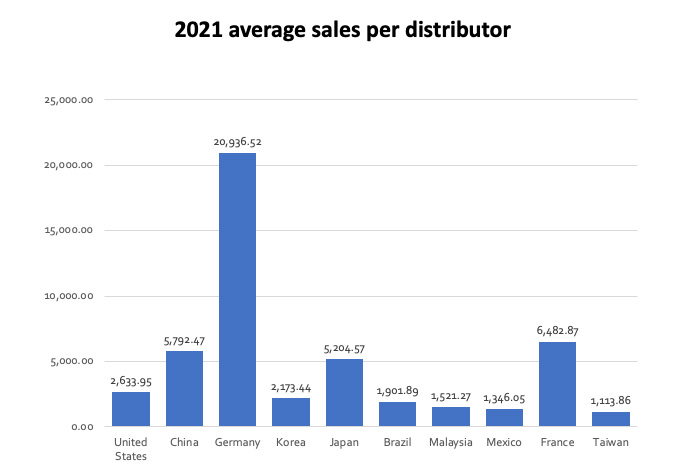
| Total retail sales | Distributors | Average sales per distributor | |
| United States | $42.7B | 16,200,000 | $2,633.95 |
| China | $17.9B | 3,100,751 | $5,792.47 |
| Germany | $18.9B | 905,547 | $20,936.52 |
| Korea | $19.4B | 8,935,590 | $2,173.44 |
| Japan | $14.2B | 2,737,596 | $5,204.57 |
| Brazil | $7.0B | 3,705,793 | $1,901.89 |
| Malaysia | $8.4B | 5,500,000 | $1,521.27 |
| Mexico | $5.8B | 4,300,000 | $1,346.05 |
| France | $5.4B | 706,632 | $6,482.87 |
| Taiwan | $4.9B | 4,400,000 | $1,113.86 |
German distributors are so far ahead, it seems like an error. (We triple checked our math.) China, France, and Japan also have what I would consider high per-distributor sales. Note that China and Japan are outliers in this as Asian nations; remember that in the matching regional breakdown, Asia was somewhat behind.
Another issue you need to look at when expanding into a country is the average income of a person living in that country. There are different kinds of averages that you can look at. Again, median income provides a more accurate picture of the average person’s salary, but up-to-date data on mean income (specifically gross national income per capita) around the globe is easier to come by. Let’s look at those numbers for the top ten countries—excluding Taiwan for which there is no reported GNI.
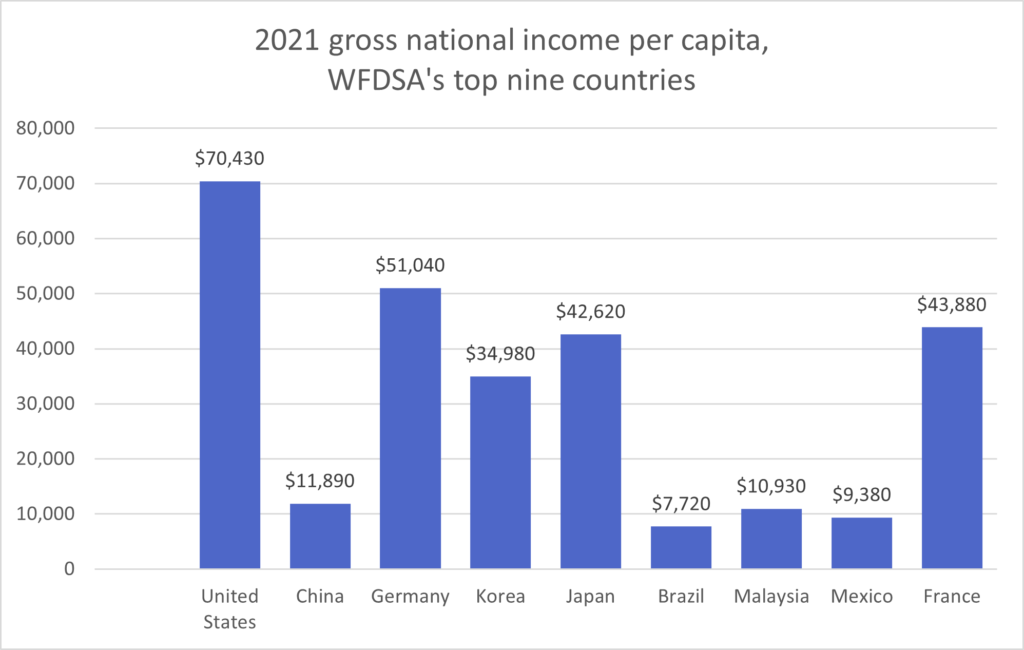
A few things stand out here.
Income isn’t a strong predictor of whether direct sales will do well in a given country. From left to right, these countries are graphed from greatest total sales to least sales. Their per capita incomes are all over the place.
That said, all the top ten countries (the ones that reported GNI anyway) have a per capita income greater than $7000 USD. Which makes sense if you think about it. Many (though not all) MLM products are “luxury” goods. They’re typically things consumers want more than they need. In countries where people are struggling to survive, they’re not likely to buy luxury goods.
Income also isn’t a strong predictor of average sales per distributor. The US has the highest per capita income (about $74K) but has a relatively low average sales per distributor ($2,633).
The takeaway from these numbers seems to be that when you’re deciding if a country would be worth entering, you can’t look at the numbers alone and think you’ve done your homework. You have to learn more about the people you’ll be selling to. You have to know who they are. In other words, culture—interest in and compatibility with direct selling and with popular direct sales products—accounts for the prevalence of the sales model.
Want help entering international markets? Reach out to us at MLM Compensation Consulting. We offer data-driven compensation plan design and analysis.